
Abstract
One-third of the irrigated land in the major irrigation countries is affected by salinity or is expected to become so in the near future. A rapid assessment to evaluate the effect of changes in irrigation water quality and quantity is applied for the Rudasht irrigation project in Iran. This was performed by using a physically based, well-tested simulation model for crop growth, water and salt transport at field scale. Results indicate that the current practice of 900 mm annual irrigation application rates for cotton, given the current salinity level of 4 dS m-1, is close to the optimal one. Graphs are presented to evaluate the effect of different combinations of application rates and salinity levels on yields, and the water and salt balance. It was concluded that the methodology presented here is versatile, rapid, and transferable to other conditions. Moreover, the method produces output at a high spatial and temporal resolution over a long time frame.
Introduction
Salinity is one of the major problems in irrigated agriculture all over the world. Many areas are facing reduced production as a result of salinity and, even worse, areas have been abandoned for any agricultural activity due to severe salinity levels. It is estimated that roughly one-third of the irrigated land in the major irrigation countries is already badly affected by salinity or is expected to become so in the near future (Kijne et al., 1998). Some estimates for major irrigation countries are: Pakistan 14 percent, China 15 percent, India from 27 to 60 percent, Egypt 30 percent, and Iraq 50 percent (Ghassemi et al., 1995). Two major salinity problems are likely to occur in irrigated areas if no careful irrigation management is applied. First of all, salts will accumulate in the soil as irrigation water always contains some salts, while water transpired by plants or evaporated by the soil will not remove any salts. In an attempt to reduce this salt accumulation, a surplus of irrigation water is supplied to leach these salts from the root zone. This leads in many cases to a second problem, water logging due to rising groundwater. Often, this groundwater is also very saline and will increase the salinity level of the root zone substantially. So, irrigation applications must be large enough to minimize salt accumulation in the root zone and low enough to limit the hazard of water logging. Obviously, problems related to water logging can also be diminished by an adequate drainage system.
Field trials can be useful to analyze and test different scenarios related to salinity. However, several important limitations of these field experiments have become more and more apparent. First of all, their validity is limited to the area and the physical conditions the experiments have been conducted. Secondly, field trials are often conducted over a short period of a couple of years, ignoring a very important topic in salinity related problems: the long-term effects. These long-term effects can be a gradual, but constant, salt accumulation in the root zone and the groundwater, as well as in rising or falling water tables. Finally, the number of scenarios that can be studied by field experiments is necessary limited, given practical considerations as labor input, available fields, and noticeable expenses. Simulation models can be applied as an extension of field tests to overcome these restrictions of field experiments. Nowadays, well-tested and validated simulation models are available and are ready to be applied to answer questions related to salinity.
For the Rudasht irrigation project in the Zayandeh Rud basin in Iran a rapid assessment procedure was tested based on the SWAP model; a physically based, well-tested simulation model for crop growth, water and salt transport at field scale. No measurement campaign was conducted but data from an existing data set was used. Emphasis will be put on the output from the model in terms of long term effects, spatial and temporal resolution, expected crop yields, and water and salt balances.
In summary the objectives of this paper are to demonstrate the possibility of making combined use of data and a simulation model for a rapid assessment of salinity problems. This approach was tested by analyzing the water and salt balance and yields in relation to the quantity and quality of water applied for irrigation.
Materials and methods
Study area
The Rudasht irrigation project (52o lon., 32.5o lat) is located east of Esfahan in the central part of Iran and has an altitude of approximately 1500 m (Fig. 1). The climate is arid with temperatures ranging from 30oC in summer down to 3oC in winter. Average annual precipitation is 150 mm. Soils in the area are alluvial deposits and are fine textured. The old irrigation system will be expanded, which will result in a total command area of approximately 47,000 ha. Main crops are winter wheat and barley, sugar beet, cotton and melons.
Simulation model
The Soil-Water-Atmosphere-Plant (SWAP) model was applied to simulate all the terms of the water and salt balance and to estimate relative yields (actual over potential yield). SWAP is an integrated physically based simulation model for water, solute and heat transport in the saturated-unsaturated zone in relation to crop growth. For this study the water and salt transport and crop growth modules were used. The first version of the SWAP model was already written in 1978 (Feddes et al., 1978) and from then on a continuous development of the program started. The version used for this study is SWAP2.0 and is described by Van Dam et al. (1997).
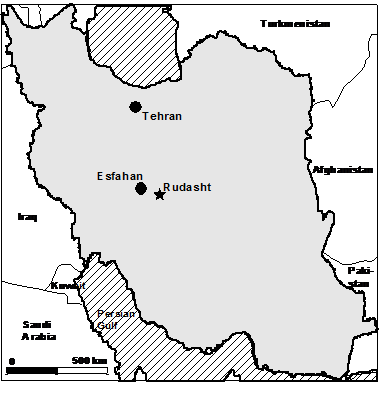
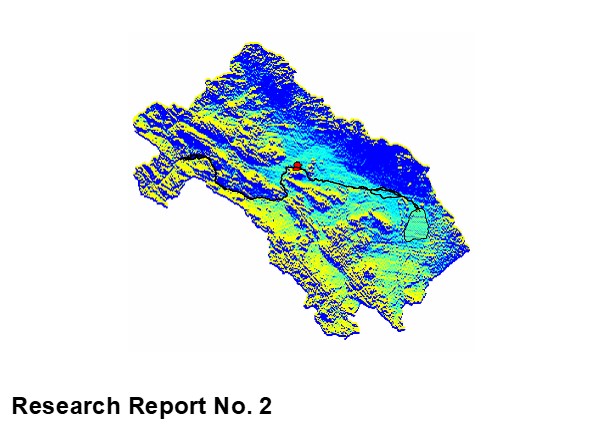
Figure 1. Location of the Roodhast area in the Esfahan region, Iran.
The core part of the program is the vertical flow of water in the unsaturated-saturated zone, which can be described by the well-known Richards’ equation:
(1)
where q denotes the soil water content (cm3 cm-3), t is time (d), h (cm) the soil matric head, z (cm) the vertical coordinate, taken positive upwards, K the hydraulic conductivity as a function of water content (cm d-1). S (d-1) represents the water uptake by plant roots (Feddes et al., 1978), defined in case of an uniform root distribution as:
(2)
with Tpot is potential transpiration (cm d-1), zr is rooting depth (cm), and a (-) is a reduction factor as function of h and accounts for water deficit and oxygen deficit. Except for the very wet conditions, unlimited water uptake by plants was at h > -1000 cm Between these points and permanent wilting point, h = -5000 cm, a linear reduction was assumed. Below h = -5000 cm water uptake was assumed to be zero. Total actual transpiration, Tact, was calculated as the depth integral of the water uptake function S.
Actual soil evaporation can be estimated by the Richards’ equation using the potential evaporation as the upper boundary condition. However, this requires information about the soil hydraulic properties of the first few centimeters of the soil, which are hardly measurable and are highly variable in time as a consequence of rain, crust and crack formation, and cultivation (Van Dam et al, 1997). All these processes reduce the real actual evaporation in comparison with the values obtained by applying Richards’ equation. Therefore the additional soil reduction function option from SWAP was implied, whereby the actual evaporation is a function of the potential evaporation, the soil moisture content of the top soil, an empirical soil specific parameter, and the time since the last significant rainfall. Details of this procedure are given by Boesten en Stroosnijder (1986).
Crop yields can be computed using a simple crop growth algorithm based on Doorenbos and Kassam (1979) or by using a detailed crop growth simulation module that partitions the carbohydrates produced between the different parts of the plant, as a function of the different phenological stages of the plant (Van Diepen et al. 1989). For this specific case the first method was used as detailed crop parameters were lacking. Potential evapotranspiration is partitioned into potential soil evaporation and crop transpiration using the leaf area index. Actual crop transpiration and soil evaporation are obtained as a function of the available soil water in the top layer or the root zone for, respectively, evaporation and transpiration. Finally irrigation can be prescribed at fixed times, scheduled according to different criteria, or by using a combination of both.
SWAP can deal with solute transport processes in general. For salinity studies it can be assumed that salt can be described as a conservative solute, no adsorption or decomposition, and diffusion rate is very small, so it can be ignored. This implies that salt transport is only governed by the convection-dispersion process. The effect of salinity on crop yields is taken into account and is defined by a critical ECe level below which no salt stress occurs and the decline of rootwater uptake above this ECe maximum level in percentage crop yield reduction per dS m-1. For the cotton crop used here the ECe maximum is defined as 7.7 dS m-1 and the decline as 5% per dS m-1 (Doorenbos and Kassam, 1979).
The SWAP model has been applied and tested already for many different conditions and locations and has been proven to produce reliable and accurate results. A more detailed description of the model and all its components is beyond the scope of this paper, but can be found in Van Dam et al. (1997).